Dublin-built intelligence

Why VectorPilot AI exists

We built VectorPilot AI to clear the fog around operational reporting. Teams were drowning in dashboards, yet still guessing the next move. So we started with a simple question: what if the data could point the way, not just sit there waiting?

From our Dublin base, we design AI systems that turn live operational signals into practical guidance. You get sharper navigation, cleaner reporting, and models that explain themselves without the usual black-box theatre.

Data strategists reviewing predictive dashboard panels in a modern Dublin office with warm daylight and layered screens

Irish roots. Built for teams that need clearer operational direction, not just prettier charts.

Practical AI. We focus on decisions, time saved, and measurable guidance. What else matters?

Why we built VectorPilot AI

A story shaped by operational frustration

The brief was never “make another dashboard”. It was, “help us know what to do next.” That difference changed everything.

Our founders spent years inside reporting cycles where the numbers arrived late, the commentary was vague, and the next step still had to be guessed. Sound familiar? When navigation teams, operations leads, and decision-makers all ask for the same thing, the signal is obvious.

So VectorPilot AI grew from a very specific pain point: business intelligence that looks polished but doesn’t guide action. We combine predictive analytics, dashboard automation, and custom models to surface the path forward before the bottlenecks bite.

Being based in Dublin matters to us. It keeps the team close to a city that blends commercial discipline with technical ambition, and it gives our work a grounded, practical edge. We’re not chasing hype. We’re building systems people can trust on a busy Monday morning.


Our guiding principles

Clarity, evidence, and automation people can read

Good AI shouldn’t feel mysterious. It should feel useful, legible, and calm under pressure.

Clarity over complexity

We strip the noise away so the decision is obvious. If a chart needs a paragraph to explain itself, we go back and simplify it.

Prediction grounded in operations

Our models are trained on real behaviours, real routes, and real reporting patterns. Guesswork belongs in the past, doesn’t it?

Transparent automation

We build explainable flows and governed outputs, so your team knows why a recommendation appears and what to do with it next.

The people behind the models

A small team with deep BI and AI instincts

No bloated committee. Just specialists who know how to connect data science, dashboard design, and operational reality.

Data science lead at a laptop with predictive charts and notebooks in a quiet studio workspace
Data science lead

Rory Quinn

Rory shapes the modelling approach, balancing statistical rigour with deployable outputs. He’s happiest when a model can be explained in plain English before lunch.

  • Forecasting and anomaly detection
  • Responsible AI checks
  • Operational performance modelling
Product and dashboard design lead reviewing interface layouts on a tablet beside colour swatches and charts
Product and dashboard design lead

Eimear Kavanagh

Eimear translates complexity into interfaces people actually enjoy using. Her rule is simple: if a dashboard slows you down, it’s not finished.

  • Visual hierarchy and UX flow
  • Reporting templates and automation
  • Executive-ready dashboard storytelling
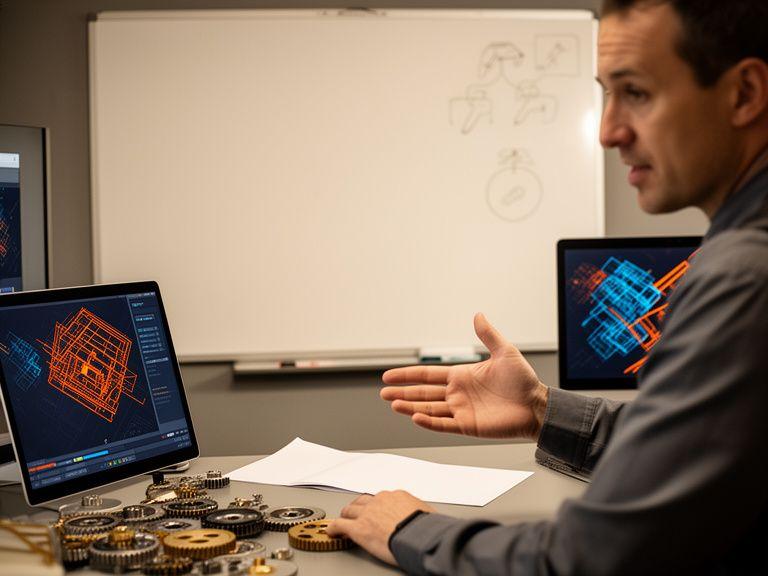
Technical operations specialist discussing KPI overlays and routing data with a whiteboard in the background
Technical operations adviser

Caleb Fitzpatrick

Caleb bridges implementation and real-world use. He keeps every build tied to process, governance, and the people who rely on the outputs daily.

  • Data governance and access control
  • Integration planning
  • Deployment readiness and support
How we build custom AI models

A careful process for operational guidance

Custom AI works best when the path is deliberate. Fast isn’t enough. It has to be trustworthy.

1

We map the workflow

First, we learn how decisions actually happen. Where do delays begin? Which data sources are reliable? What does “good” look like on the ground?

2

We shape the model

Then we build predictive logic around the real operating context, tuning for useful guidance rather than abstract accuracy alone.

3

We govern the output

Every solution includes checks for explainability, permissioning, and data quality. Why launch a model nobody can defend?

Our technical approach keeps humans in the loop. That’s not a slogan; it’s how we avoid brittle automation and build confidence into every workflow.

We use your operational data to create dashboards and models that prioritise action. The result? Cleaner reporting cycles, faster navigation decisions, and fewer hours spent second-guessing what the data means.

Responsible AI and data governance sit at the centre of the process. Access is controlled. Outputs are traced. And when something changes, the system can be adjusted without tearing everything down.

Want a clearer way forward?

Let’s talk about the operational bottlenecks you want to remove and the dashboard automation that could replace them.

Start a conversation

This website uses cookies to enhance your experience and improve our AI-powered dashboards. By continuing, you agree to our use of cookies.